IN EKOS Politics’ latest five-day roll-up, the Liberals are at 49 points and the party holds a 15-point lead over the Conservatives, who remain steady at 33.1 per cent in its latest three-day roll-up.
Its parallel online poll using its probability-based panel, Probit, shows similar results (47.1 per cent to 32.7 per cent). The NDP, meanwhile, is at between 6.9 and 10.2 per cent nationally.
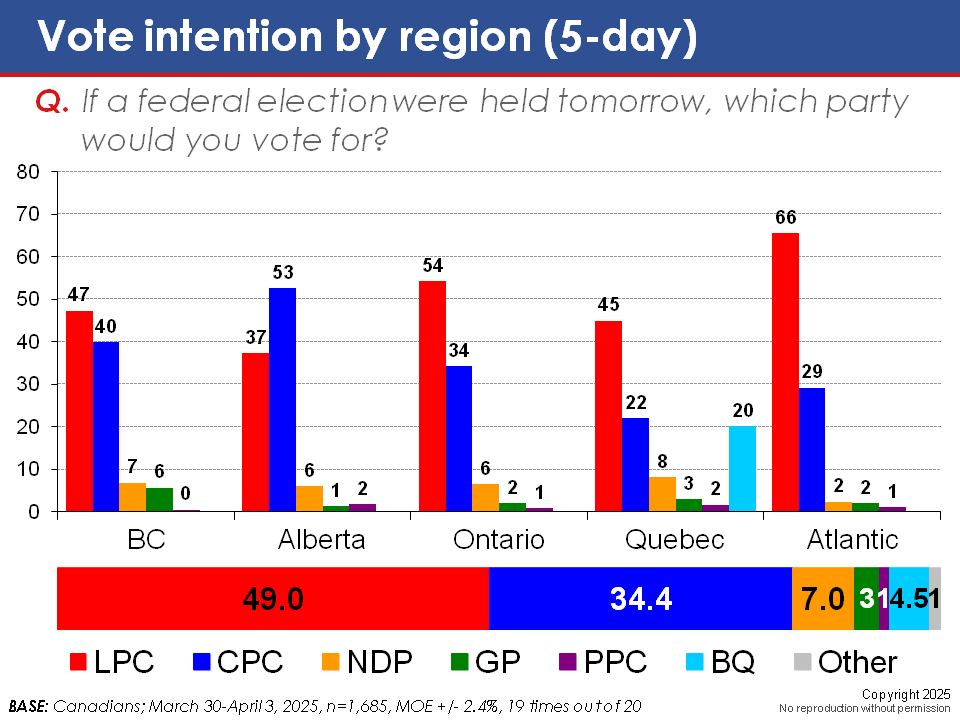
Regionally, the Liberal Party is poised to sweep Atlantic Canada and holds decisive leads in both Ontario and Quebec. Their lead in British Columbia has narrowed to just seven points, though the province has historically been fluid in terms of vote intention. In Alberta, the Conservative lead has narrowed somewhat. Although they still hold a 16-point advantage, Liberal support in the province remains consistently above 30 points, suggesting a genuine shift, even if the small sample size warrants some caution.
Demographically, results reveal a huge and unprecedented gender gap. The Liberals enjoy a more than two-to-one lead among women, while the Conservatives have a slight edge among men. The Liberals also hold a significant lead among university graduates and Canadians over 50, two of Canada’s more reliable voting blocks.


Turning to an online survey conducted using its probability-based panel, Probit, EKOS Politics asked decided and leaning voters to identify their second choice. Results suggest the NDP has, by far, the most room for growth, with one-quarter of Canadians naming them as their second choice. One in seven would consider the Liberals as a second choice, giving the party a theoretical vote ceiling of 61 per cent. The Conservative Party, meanwhile, has far less room for expansion and the party’s efforts will be limited to a potential payoff of just seven points, which would still likely fall short of a victory.


EKOS Politics also explored the issue of voter commitment and the question of whether the Liberals are being buoyed by a “soft” vote prone to changing allegiances or simply staying home on Election Day. Before looking at individual indicators of voter commitment, it is worth noting that, if we apply the 30-point turnaround the Liberals have seen over the past three months to Canada’s roughly 30 million eligible voters, about nine million people have moved to the Liberals, suggesting there is something quite visceral producing such as a staggering shift, EKOS Politics noted.
First, it asked respondents about their likelihood of changing their minds before the election. Both Liberal and Conservative support appears equally well entrenched, with just one in seven indicating they are open to switching.

Next, it asked respondents how certain they are to vote on Election Day. Naturally, there is a social desirability bias associated with voting so this indicator should be interpreted with caution. Nevertheless, Liberal and Conservative voters are both equally likely to say they are committed to showing up to the polls on April 28.

It also asked respondents whether they knew the date of the next federal election. Again, self-assessed knowledge carries some bias, but it is notable that Liberal voters are somewhat more likely to say they know the exact date of the election.

Liberal voters are also more likely to be motivated by hope. Conservative voters, while quite hopeful, are three times more likely to characterize their outlook as discouraged, an emotion typically associated with lower voter engagement. However, Conservatives are also more likely to express anger, which can be a powerful motivator for turnout.

Finally, we note a large majority of Canadians (75 per cent) say the upcoming election will be the most important election of the past 50 years, compared to just eight per cent who see it as business as usual, says EKOS Politics. The Liberals have a clear advantage on this indicator (83 per cent, compared to 76 per cent among Conservative voters).

All in all, the Liberals enjoy a clear, stable, and seat-efficient lead. In our three-day roll-up, the party’s lead rises further from 15 to 17 points. There is no evidence of an engagement advantage for the Conservative Party. While the election is still 24 days away, barring some major scandal, the Liberals appear on track to form a majority government.
Methodology:
This research draws on results from two surveys. The first survey was conducted using Interactive Voice Response (IVR) technology, which allows respondents to enter their preferences by punching the keypad on their phone, rather than telling them to an operator. In an effort to reduce the coverage bias of landline-only random digit dialling (RDD), EKOS Politics created a dual landline/cell phone RDD sampling frame for this research. As a result, it is able to reach those with a landline and cell phone, as well as cellphone-only households and landline-only households.
The field dates for the three-day roll-up are April 1-3. In total, a random sample of 1,091 Canadians aged 18 and over responded to the survey. The margin of error associated with the total sample is +/- 3.0 percentage points, 19 times out of 20.
The field dates for the five-day roll-up are March 30-April 3. In total, a random sample of 1,685 Canadians aged 18 and over responded to the survey. The margin of error associated with the total sample is +/- 2.4 percentage points, 19 times out of 20.
The remaining survey was conducted using EKOS’ unique, hybrid online/telephone research panel, Probit. Its panel offers exhaustive coverage of the Canadian population (i.e., Internet, phone, cell phone), random recruitment (in other words, participants are recruited randomly, they do not opt themselves into our panel), and equal probability sampling. All respondents to our panel are recruited by telephone using random digit dialling and are confirmed by live interviewers. Unlike opt-in online panels, Probit supports margin of error estimates.
The field dates for the Probit survey are March 28-April 2, 2025. In total, a random sample of 1,513 Canadians aged 18 and over responded to the survey. The margin of error associated with the total sample is +/- 2.5 percentage points, 19 times out of 20.
Note that the margin of error increases when the results are sub-divided (i.e., error margins for sub-groups such as region, sex, age, and education). All the data have been statistically weighted by age, gender, region, and educational attainment to ensure the sample’s composition reflects that of the actual population of Canada according to Census data. The results have also been weighted by COVID-19 vaccine uptake to better represent the institutionally mistrustful, who are often less likely to participate in surveys.