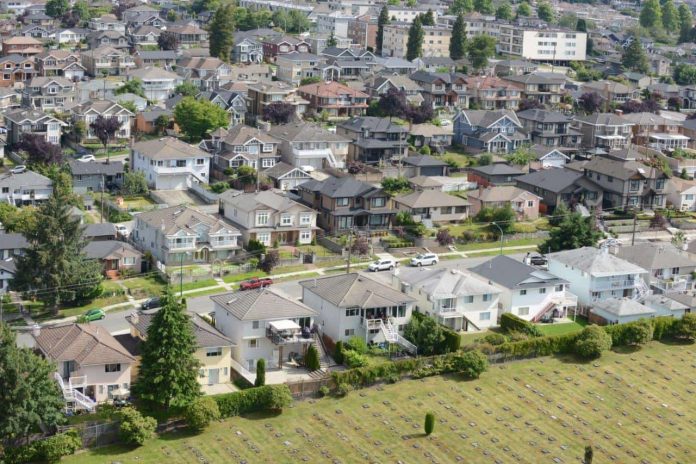
ANALYSIS released on Tuesday by Paul Sullivan, senior partner at Burgess, Cawley, Sullivan & Associates Ltd. a leading commercial real estate and property tax appraisal firm, shows that between April 2018 and April 2019, properties across Metro saw an astonishing $89.2 billion in estimated lost homeowner equity.
The analysis, prepared using publicly available housing data, shows striking market value loss across all municipalities in the region.
Vancouver, which has the highest number of dwellings, saw a nearly 13% decrease, for a total of $43.6 billion.
West Vancouver saw the highest percentage decrease, at 14.68%.
Port Coquitlam shows a staggering 10.23% decrease, with a dollar value of over $1.5 billion. Almost half of those billions in losses are outside Vancouver and West Vancouver.
Why is this important?
Sullivan makes three key points:
Homeowners rely on the equity in their homes, usually their biggest investment, to fund things like home renovations, post-secondary education, senior care costs, and retirement. While MLA’s, academics, and public sector workers rely on secure, taxpayer-funded pension plans, many British Columbians rely on the equity in their home to get them through retirement, and to leave something for their children. This equity loss leaves many seniors, who have tried to plan carefully, in jeopardy.
The impact on the economy and jobs will likewise be devastating. A recent BC Real Estate Association analysis confirms that a 10% equity loss translates to 26,000 jobs lost, $1.8B in lost retail sales, plus lost tax revenues to government.
“It makes sense, when you simultaneously lose equity in your home and face increased taxes, something’s gotta give,” states Sullivan. “Families make difficult choices, which means a loss to local businesses and a great loss to the economy.”
And for many, deferring taxes is simply not an option. Many homeowners do not realize that you must hold at least 25% equity in your home to qualify for deferral, which may be increasingly difficult for many across our region as equity plummets. Those who do defer may face a tax bill upon the sale of their property that erodes any gains they have made in real estate value.
“While the government’s goal may indeed be to bottom out the housing market in an attempt to somehow address the complex issue of affordability, they are simply removing billions of dollars from the B.C. economy, to everyone’s detriment,” added Sullivan. “This provincial government suggests you don’t deserve to have that real estate “wealth” and should pay even more, on top of rising income taxes, the highest gas prices in North America and ballooning ICBC and utility fee increases. The impact of the school tax surcharge on homes assessed at over $3M, for example, means an average 35% increase across Vancouver, although many of those homes have seen assessments plummet since the BC NDP took power.”
Sullivan was to release this analysis at an event hosted by STEPUP, a grassroots advocacy organization, about housing policy in B.C.
REPORT: EQUITY LOSS ACROSS METRO VANCOUVER APRIL 2018-APRIL 2019
|
Municipalities |
Metro Vancouver Housing Data Book # of Dwellings 2016 |
2018 Authenticated Roll Residential Property Class Taxable Values |
Indicated Value Loss Real Estate Board of Greater Vancouver and Fraser Valley All Property Types % April 2018 to April 2019 |
Equity Loss |
Equity Loss Per Household |
|
Burnaby |
92,200 |
$85,564,982,198 |
-6.14% |
-$5,255,234,334 |
-$56,998 |
|
Coquitlam |
51,325 |
$46,906,972,055 |
-9.39% |
-$4,406,687,435 |
-$85,858 |
|
Delta |
35,760 |
$31,095,435,331 |
-7.79% |
-$2,421,474,892 |
-$67,715 |
|
Langley |
53,820 |
$37,444,463,796 |
-8.70% |
-$3,256,323,155 |
-$60,504 |
|
Maple Ridge |
30,255 |
$21,027,290,153 |
-4.76% |
-$1,000,945,965 |
-$33,084 |
|
New Westminster |
32,710 |
$19,139,612,253 |
-7.06% |
-$1,351,187,604 |
-$41,308 |
|
North Vancouver |
55,760 |
$20,800,538,231 |
-6.37% |
-$1,324,762,753 |
-$23,758 |
|
Pitt Meadows |
7,195 |
$4,431,635,625 |
-4.76% |
-$210,955,752 |
-$29,320 |
|
Port Coquitlam |
21,755 |
$15,231,040,883 |
-10.23% |
-$1,558,402,006 |
-$71,634 |
|
Port Moody |
12,975 |
$11,096,828,822 |
-6.89% |
-$764,111,868 |
-$58,891 |
|
Richmond |
73,455 |
$80,530,838,248 |
-8.73% |
-$7,033,280,540 |
-$95,750 |
|
Surrey |
169,965 |
$131,373,245,361 |
-6.71% |
-$8,809,122,917 |
-$51,829 |
|
Vancouver |
283,915 |
$339,880,080,731 |
-12.85% |
-$43,686,875,235 |
-$153,873 |
|
West Vancouver |
16,930 |
$52,061,252,030 |
-14.68% |
-$7,641,946,443 |
-$451,385 |
|
White Rock |
10,005 |
$8,901,213,912 |
-5.55% |
-$494,037,315 |
-$49,379 |
|
Total |
-$89,215,348,214 |
Source: Burgess Cawley Sullivan & Associates Ltd. Data from BC MLS and Fraser Valley Real Estate Board.
This chart shows actual decrease in median sale price.


