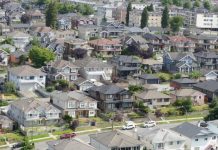
IN the next few days, owners of more than 1,076,600 properties throughout the Lower Mainland can expect to receive their 2022 assessment notices which reflect market value as of July 1, 2021.
These examples demonstrate market trends for single-family residential properties by geographic area:*
|
Single Family Home Changes by Community |
2021 Typical Assessed Value
as of July 1, 2020 |
2022 Typical Assessed Value
as of July 1, 2021
|
% Change |
| City of Vancouver | $1,717,000 | $1,997,000 | +16% |
| University Endowment Lands | $4,923,000 | $5,461,000 | +11% |
| City of Burnaby | $1,449,000 | $1,725,000 | +19% |
| City of Coquitlam | $1,187,000 | $1,499,000 | +26% |
| City of Port Coquitlam | $944,000 | $1,233,000 | +31% |
| City of Port Moody | $1,265,000 | $1,627,000 | +29% |
| City of New Westminster | $1,119,000 | $1,388,000 | +24% |
| City of North Vancouver | $1,452,000 | $1,777,000 | +22% |
| District of North Vancouver | $1,578,000 | $1,932,000 | +22% |
| District of West Vancouver | $2,473,000 | $2,992,000 | +21% |
| District of Squamish | $1,026,000 | $1,386,000 | +35% |
| Resort Municipality of Whistler | $2,033,000 | $2,629,000 | +29% |
| Village of Pemberton | $945,000 | $1,151,000 | +22% |
| Bowen Island Municipality | $1,019,000 | $1,271,000 | +25% |
| Village of Lions Bay | $1,436,000 | $1,934,000 | +35% |
| Village of Belcarra | $1,319,000 | $1,746,000 | +32% |
| Village of Anmore | $2,013,000 | $2,372,000 | +18% |
| Town of Gibsons | $671,000 | $895,000 | +33% |
| District of Sechelt | $600,000 | $819,000 | +37% |
| City of Surrey | $1,063,000 | $1,420,000 | +34% |
| City of White Rock | $1,242,000 | $1,582,000 | +27% |
| City of Richmond | $1,405,000 | $1,699,000 | +21% |
| City of Delta | $968,000 | $1,285,000 | +33% |
| Township of Langley | $986,000 | $ 1,319,000 | +34% |
| City of Langley | $838,000 | $1,162,000 | +39% |
| City of Abbotsford | $778,000 | $1,077,000 | +38% |
| City of Chilliwack | $627,000 | $877,000 | +40% |
| City of Maple Ridge | $814,000 | $1,118,000 | +37% |
| City of Pitt Meadows | $843,000 | $1,126,000 | +34% |
| City of Mission | $706,000 | $962,000 | +36% |
| District of Kent | $526,000 | $710,000 | +35% |
| District of Hope | $428,000 | $620,000 | +45% |
| Harrison Hot Springs | $599,000 | $807,000 | +35% |
*All data calculated based on median values.
These examples demonstrate market trends for strata residential properties (e.g. condos/townhouses) by geographic area for select urban areas:*
|
Strata Home Changes (Condos/Townhouses)By Community |
2021 Typical Assessed Value
as of July 1, 2020 |
2022 Typical Assessed Value
as of July 1, 2021
|
% Change |
| City of Vancouver | $711,000 | $759,000 | +7% |
| City of Burnaby | $588,000 | $646,000 | +10% |
| City of Coquitlam | $562,000 | $631,000 | +12% |
| City of Port Coquitlam | $506,000 | $576,000 | +14% |
| City of Port Moody | $622,000 | $732,000 | +18% |
| City of New Westminster | $512,000 | $558,000 | +9% |
| City of North Vancouver | $690,000 | $762,000 | +10% |
| District of North Vancouver | $727,000 | $834,000 | +15% |
| District of West Vancouver | $1,156,000 | $1,327,000 | +15% |
| District of Squamish | $560,000 | $724,000 | +29% |
| Resort Municipality of Whistler | $931,000 | $1,154,000 | +24% |
| City of Surrey | $510,000 | $604,000 | +18% |
| City of White Rock | $452,000 | $528,000 | +17% |
| City of Richmond | $608,000 | $677,000 | +11% |
| City of Delta | $552,000 | $625,000 | +13% |
| Township of Langley | $543,000 | $676,000 | +24% |
| City of Langley | $382,000 | $459,000 | +20% |
| City of Abbotsford | $342,000 | $412,000 | +21% |
| City of Maple Ridge | $456,000 | $563,000 | +23% |
*All data calculated based on median values.
BC Assessment’s website at bcassessment.ca includes more details about 2022 assessments, property information and trends such as lists of 2022’s top valued residential properties across the province.
The website also provides self-service access to a free, online property assessment search service that allows anyone to search, check and compare 2022 property assessments for anywhere in the province. Property owners can unlock additional property search features by registering for a free BC Assessment custom account to check a property’s 10-year value history, store/access favourites, create comparisons, monitor neighbourhood sales, and use the interactive map.
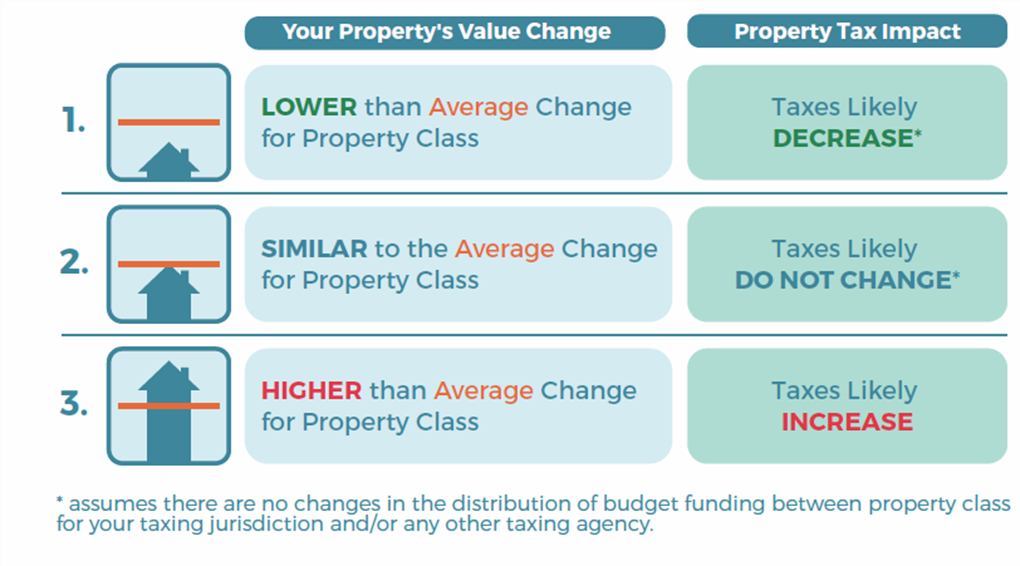
Have questions?
“If your property was impacted by the 2021 floods, mudslides or wildfires, please take a few moments to contact us toll-free at 1-866-825-8322 during January once you receive your assessment notice,” says Murao. “With your help, we can work together to make sure your property is valued correctly.”
Property owners can contact BC Assessment toll-free at 1-866-valueBC (1-866-825-8322) or online at bcassessment.ca. During the month of January, hours of operation are 8:30 a.m. to 5 p.m., Monday to Friday.
