43% would vote NDP, 22% each back BC Conservatives, BC United
NEW data from the non-profit Angus Reid Institute finds conditions comfortable yet potentially concerning for the governing BC NDP.
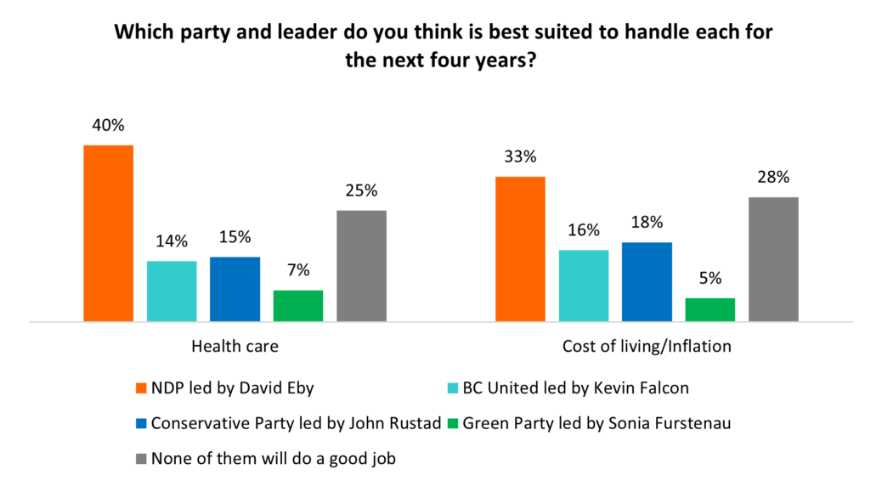
The good? The party doubles both of its closest rivals in vote intention (43% NDP, 22% BC United, 22% Conservative Party of B.C.) and is the preferred party to lead on a host of top issues facing the province, including the cost of living, and health care.
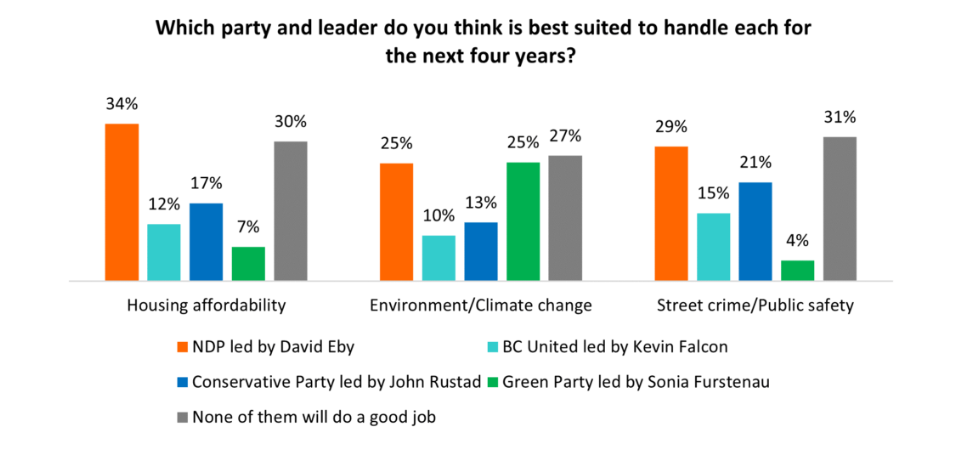
The bad? For four of the five top issues facing the province, at least seven-in-ten residents say the government is doing a poor job on each. Amid this, fully half (51%) of residents say it’s time for a change in government.
Nonetheless, a fractured opposition and a muddled political picture has the BC NDP coasting, at least for now. This, as BC United leader Kevin Falcon and B.C. Conservative Party leader John Rustad both fail to break 25 per cent in favourability. With election talk likely to continue to ramp up, both leaders will have an opportunity to meet and convince voters to make their party the real threat to the incumbent BC NDP.
More Key Findings:
- The Lower Mainland/Fraser Valley region is the most competitive in the province. Here, 35 per cent support the BC NDP, 29 per cent support the B.C. Conservatives, and 28 per cent support BC United.
- Metro Vancouver is a BC NDP strength. Half of residents say they would vote for the party in this region, with the B.C. Conservatives a distant second place (20%)
- Men are relatively divided in their vote intention, with two-in-five (38%) saying they would vote for the incumbents and one-quarter supporting each of the Conservatives (26%) and BC United (27%). Women are three times as likely to support the BC NDP than any other party.
- Half of would-be voters say they are voting to block a party they dislike rather than to support one they do like. Even among those support the incumbents, just 55 per cent say they are voting for the party because they like what it stands for, while 45 per cent say they simply dislike the other options more.
Link to the poll here: www.angusreid.org/
For detailed results by age, gender, region, education, and other demographics, click here.